Project Goal
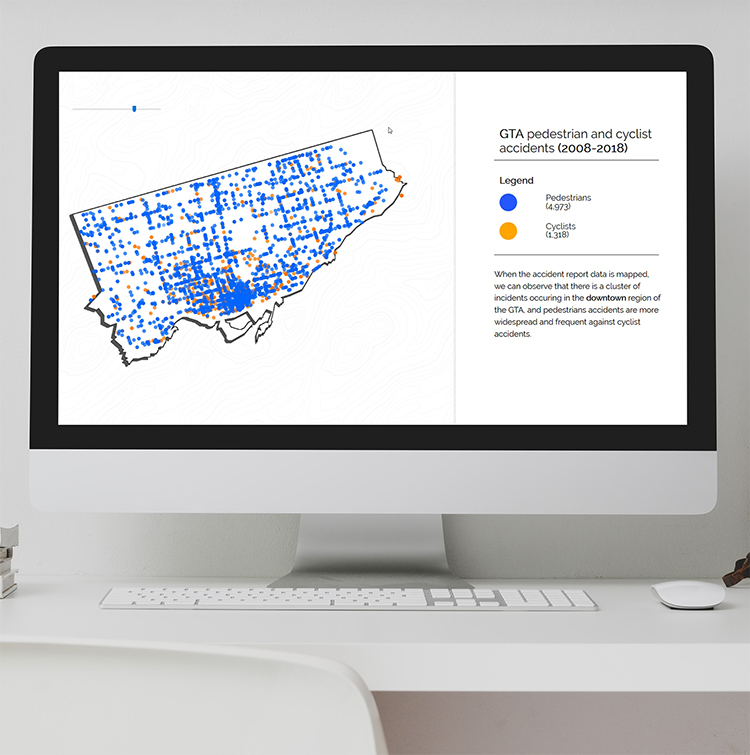
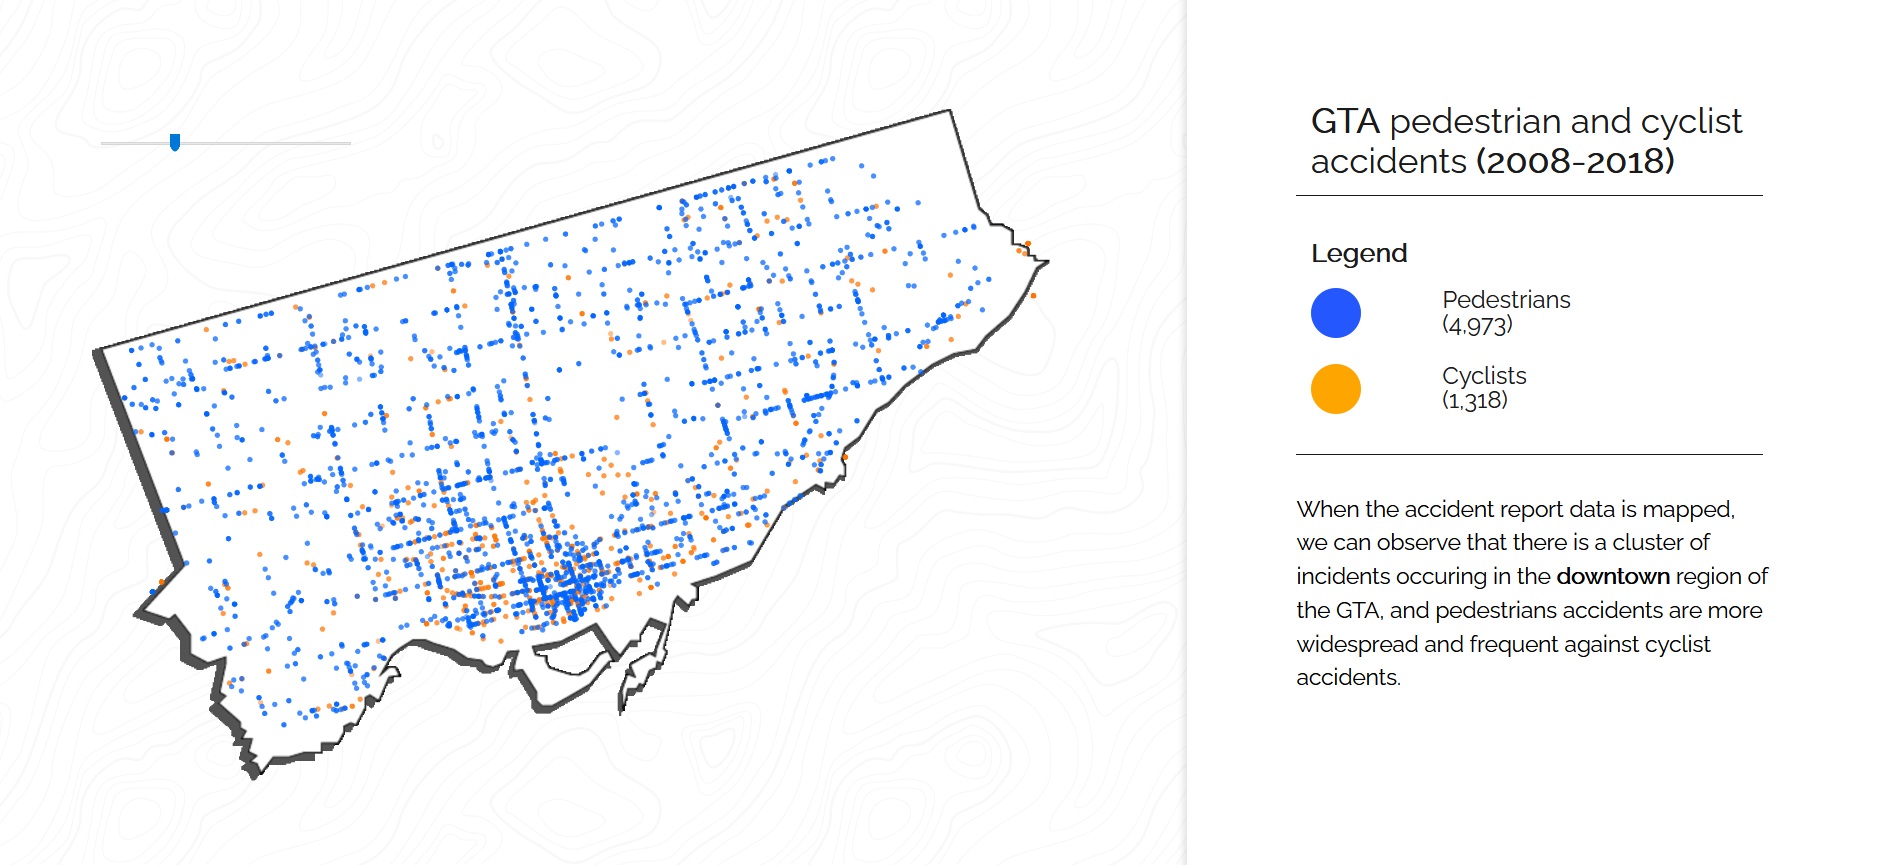
This project is centered around a large public dataset of police accident reports within the GTA. The goal is to bring attention to the unreasonably high amount of pedestrian and cyclist accidents within the GTA. This message is communicated through different data visualization mediums throughout the application.
Date
Winter 2019
Target Audience
Cable Concrete Customers
Technologies used

HTML

CSS

Javascript

Greensock

Tableau

P5.js

Google Earth Studio

After Effects
Design
The application is designed to present the data points through different mediums (videos, map visualization) as the user scrolls through. The video content was created with Google Earth Studios and Adobe After Effects. The webpage includes a map visualization that is created by inputing csv data with P5.js by latitude and longitude.


Colour
Typography
Primary-font: Raleway
Light
Regular
Semi-bold
Bold
Narrative
Research
In order to gain the most accurate insights, the Pedestrian and Cyclist data is cleaned using python and pandas. Next, Talbeau is used to efficiently visualize and explore the large dataset. Once those insights are made, the application can be designed around the story that is told through the data.

Establish
The user is immediately presented with a call to action. "The accident numbers are too high. Toronto, it's time to make way for commuters."

Build
Problematic accident prone streets are brought attention to where infrastructure is lacking.

Resolve
The city requires more secure crosswalks and bike lanes through continued infrastructure development.


